Happy Holidays! All I wanted for Christmas was more playing time for Julian Wright. I received it, but unfortunately it was due to injuries and a bone head ejection.
The end of the calendar year, is a pretty useless milestone for the NBA season (after 41 games, or during all-star break is certainly more natural), but nevertheless is an excuse for us to look at the team as a whole.
Let’s first look the “Four Factors“, which was coined by one of the “Deans” of advanced basketball statistics, Dean Oliver.
Oliver argued wins and losses can largely be attributed to four factors (with the following weights):
- Shooting (40%)
- Turnovers (25%)
- Rebounding (20%)
- Free Throws (15%)
Others have demonstrated more robust weights, but the concept is still sound.
Thankfully our friends at Hoopdata.com continually monitor this. They measure these factors as Oliver suggested here (see “Measuring the Four Factors” box)
Effective Field Goal Percentage
(Click image for larger version)
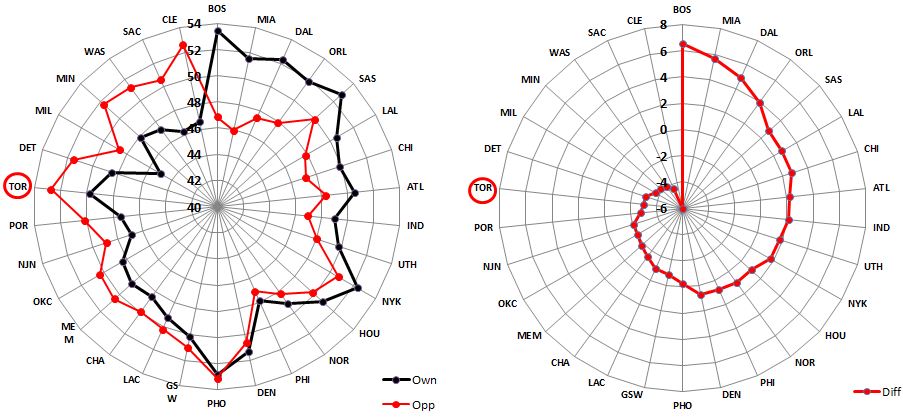
The chart is in order of effective field goal differential (start with “12 o’clock”, Boston in this case, and continue clockwise). The black data points and line are each team’s eFG while the red is what they give up to opponents. Thus the “gap” is the differential, which the second chart shows more clearly.
Toronto’s eFG is fine – we are ranked 15th at 49.8%. It’s our defense, where we are giving up 52.8%, that normally kills us. We are second worst in the league behind Phoenix.
But where are we weak? It’s quite clear:

Sixty-two percent (!!) of our opponents made shots are within 10 feet of the basket. Another 16% are from beyond the arc, another efficient area. Twenty-three percent of their made shots from mid or long 2s.
By contrast, we take 36% of our shots from mid to long 2s which represent 31% of made shots. Of course, this isn’t always by choice. Smart defensive schemes try to force mid range jumpers while taking away both the inside and close out quickly on threes.
Turnovers
(Click image for larger version)
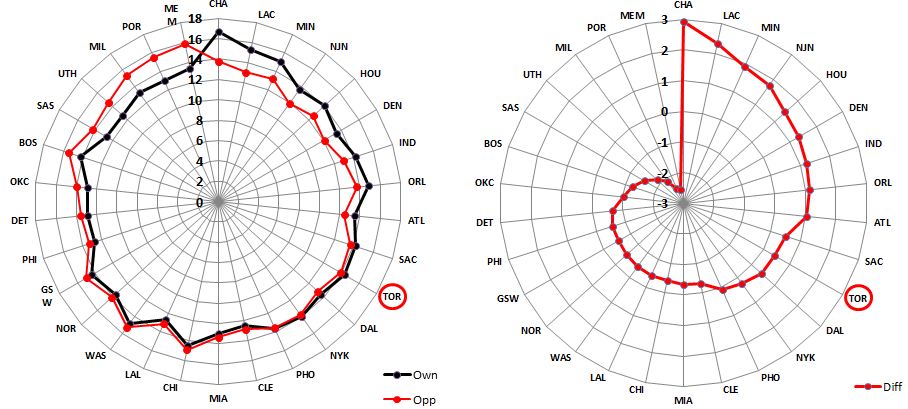
I thought turnovers were likely a larger problem as we are 3-10 in games where we turn the ball over more than 15 times. However, the Raptors are 12th at forcing turnovers. Thus, as always, the differential is the key and the Raptors rank 11th.
Rebounding
(Click image for larger version)
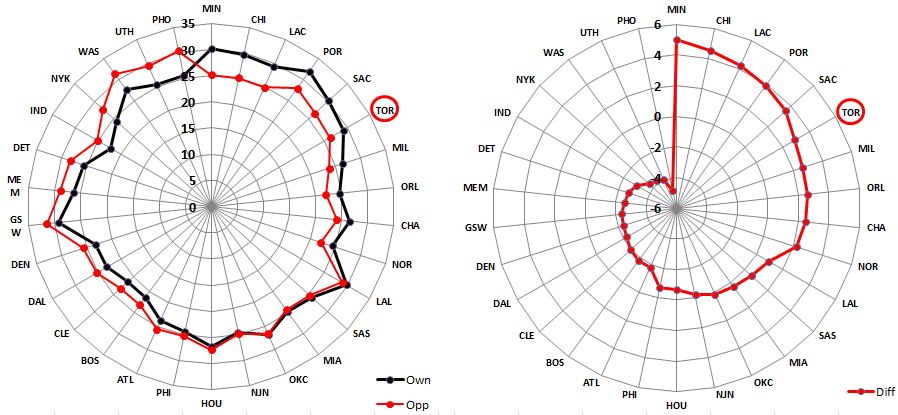
No surprise here. The one area (especially with Evans) the Raptors are efficient at is rebounding. We are sixth in offensive rebounding rate differential.
Free Throws
Oliver measures this two ways: 1) both free throws attempted divided by field goals attempted and 2) Free throw percentage (getting to the line is key, but also making them).
We are ranked 14th in getting to the line and have the 12th highest fouling rate. Our differential is 18th best.
Our free throw percentage of 75.4% is just below the league average of 76.0%. Thus, our free throw factor is in the middle of the pack.
It’s not all about points per game by individuals
Our timing is good with respect to commenting on team play. Most fans agree the recent Dallas game was one of the gutsier efforts the Raptors have put out in years.
I hope it also give some support for our quest to look at advanced metrics to help explain who contributes the most to wins. One illustration: Julian Wright has played over 21 minutes only twice this season: a win on the road against the Orlando Magic and a win on the road against the Dallas Mavericks – two tough opponents, especially on their home floor.
Yet Julian Wright averaged only 3.5 points in those games. This stresses the importance of measuring one’s play at both ends of the floor. A-Dub had this to say regarding the Dallas game “(Julian Wright) who is quickly winning some Raptor hearts over with his fine defensive play and surprisingly good court vision. The team just plays better with him on the floor.” Altraps, in Roll Call, noted: “…once again I have to say, (Wright) is almost demanding more time from Jay.”
Wright passed the ball often (many times the “second”, or “third” assist), took charges, forced their wings to shoot difficult shots, helped on D, etc. The same goes for Amir Johnson, who only scored 12 points, but also made a difference. Altraps said: “You simply couldn’t have asked for a better game from a wounded soldier.”
No doubt both of these players have poor games as well. But their intangibles and TEAM play inspire those around them. It’s infectious this team concept. It’s also, perhaps… , no wonder why they are first and second in two year adjusted +/-.
Maybe there’s something to this…


